Measuring Lab Activity
I was tasked with a simple question: "How can we measure how busy the Lab is?". This would help us quantify when we are particularly busy, show our use during non-class time, and perhaps argue for more resources.
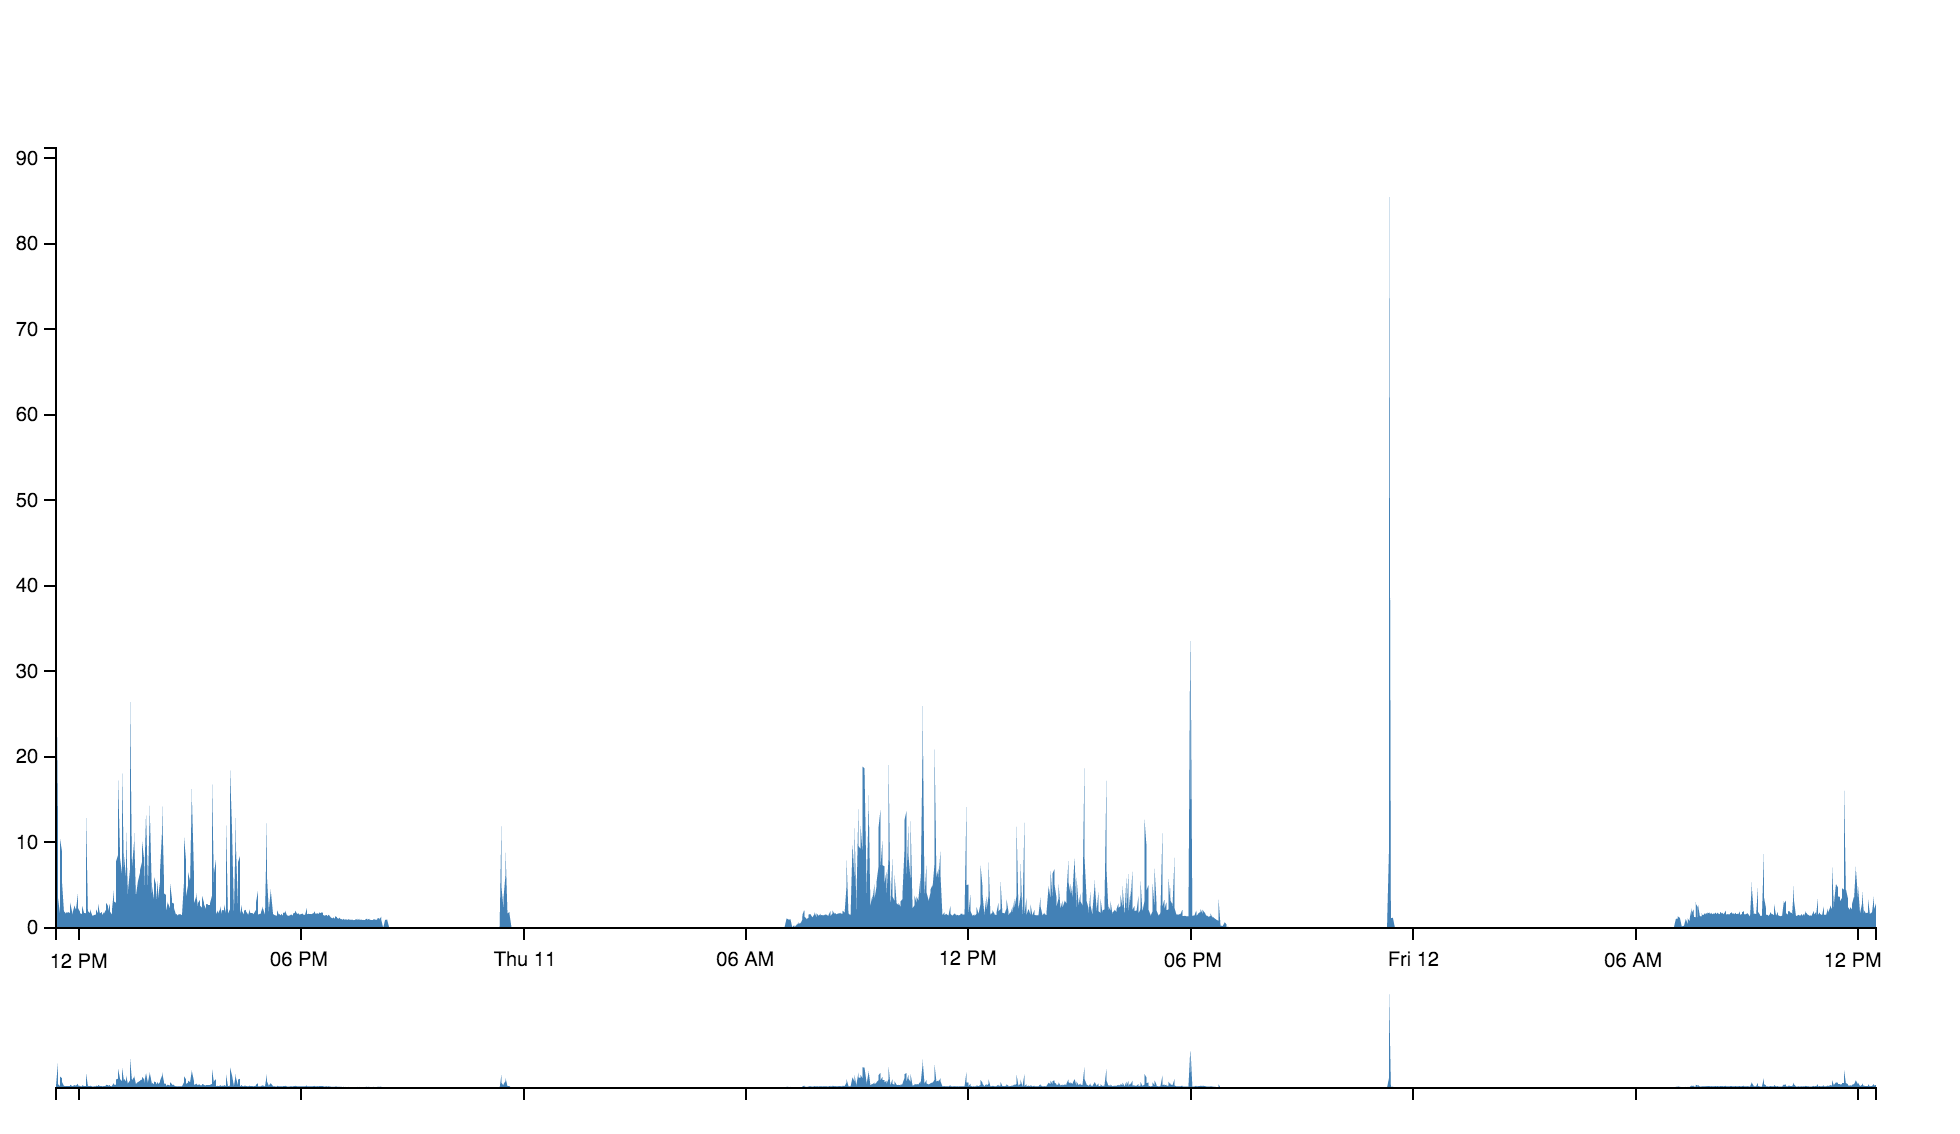
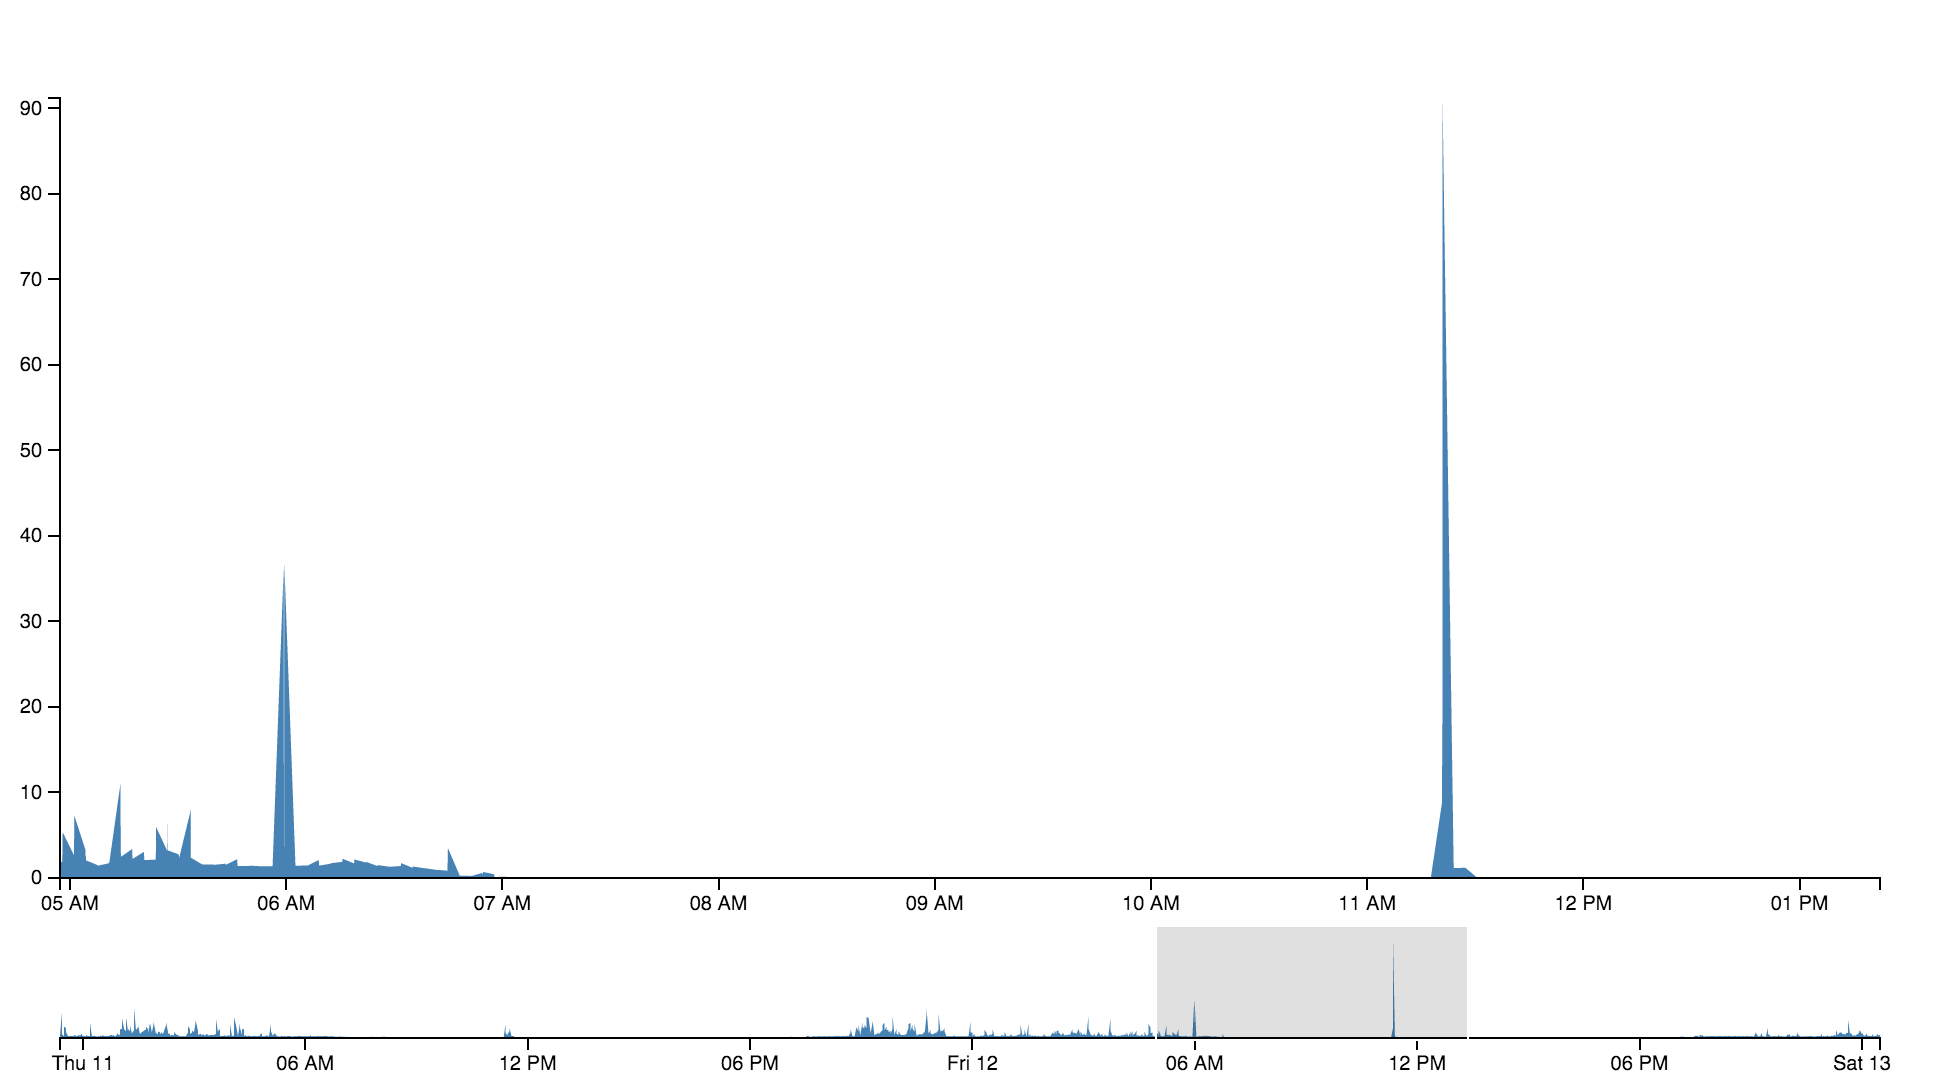
Zoomable d3 Visualization of Lab Activity
The end result. The live version provides an overview with a searchable zoom bar.
Research
Considering different options for software, hardware and eventual visualization/stats.
Hardware & Install
Pi with a camera was installed near the door, offering a view of the main work area.
Software & Basic Computer Vision
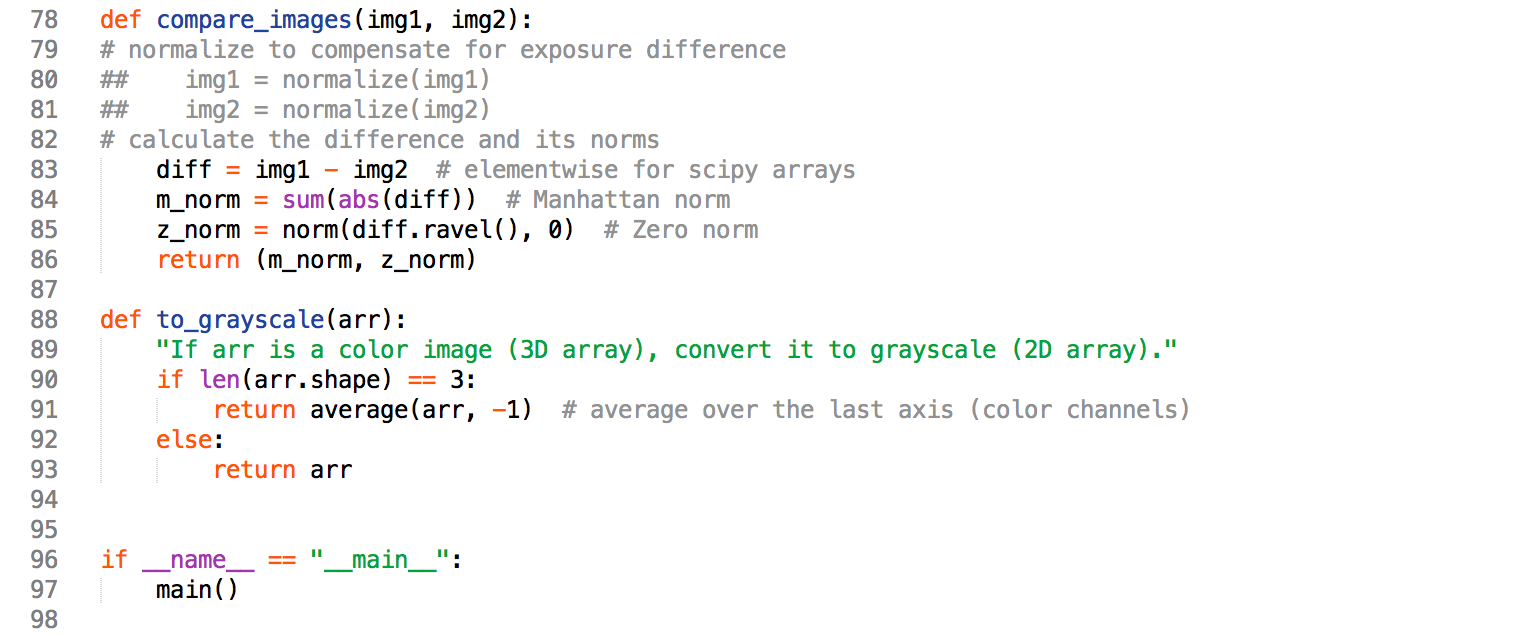
Five pictures (separated by 5 seconds) were taken every 5 minutes. The picture-arrays were translated to grayscale and then compared to each other in a pseudo-motion detection. I compared every pixel to itself between pictures, by calculating a Manhattan Norm (the absolute sum of the grayscale value changes) to give a single value for each comparison.
d3 Visualization
Implement the d3 Brush & Zoom example. Nothing special besides some time conversion. Allows users to search and visually inspect. We can easily pick out class times, daylight, cleaning times and non-standard activity.


