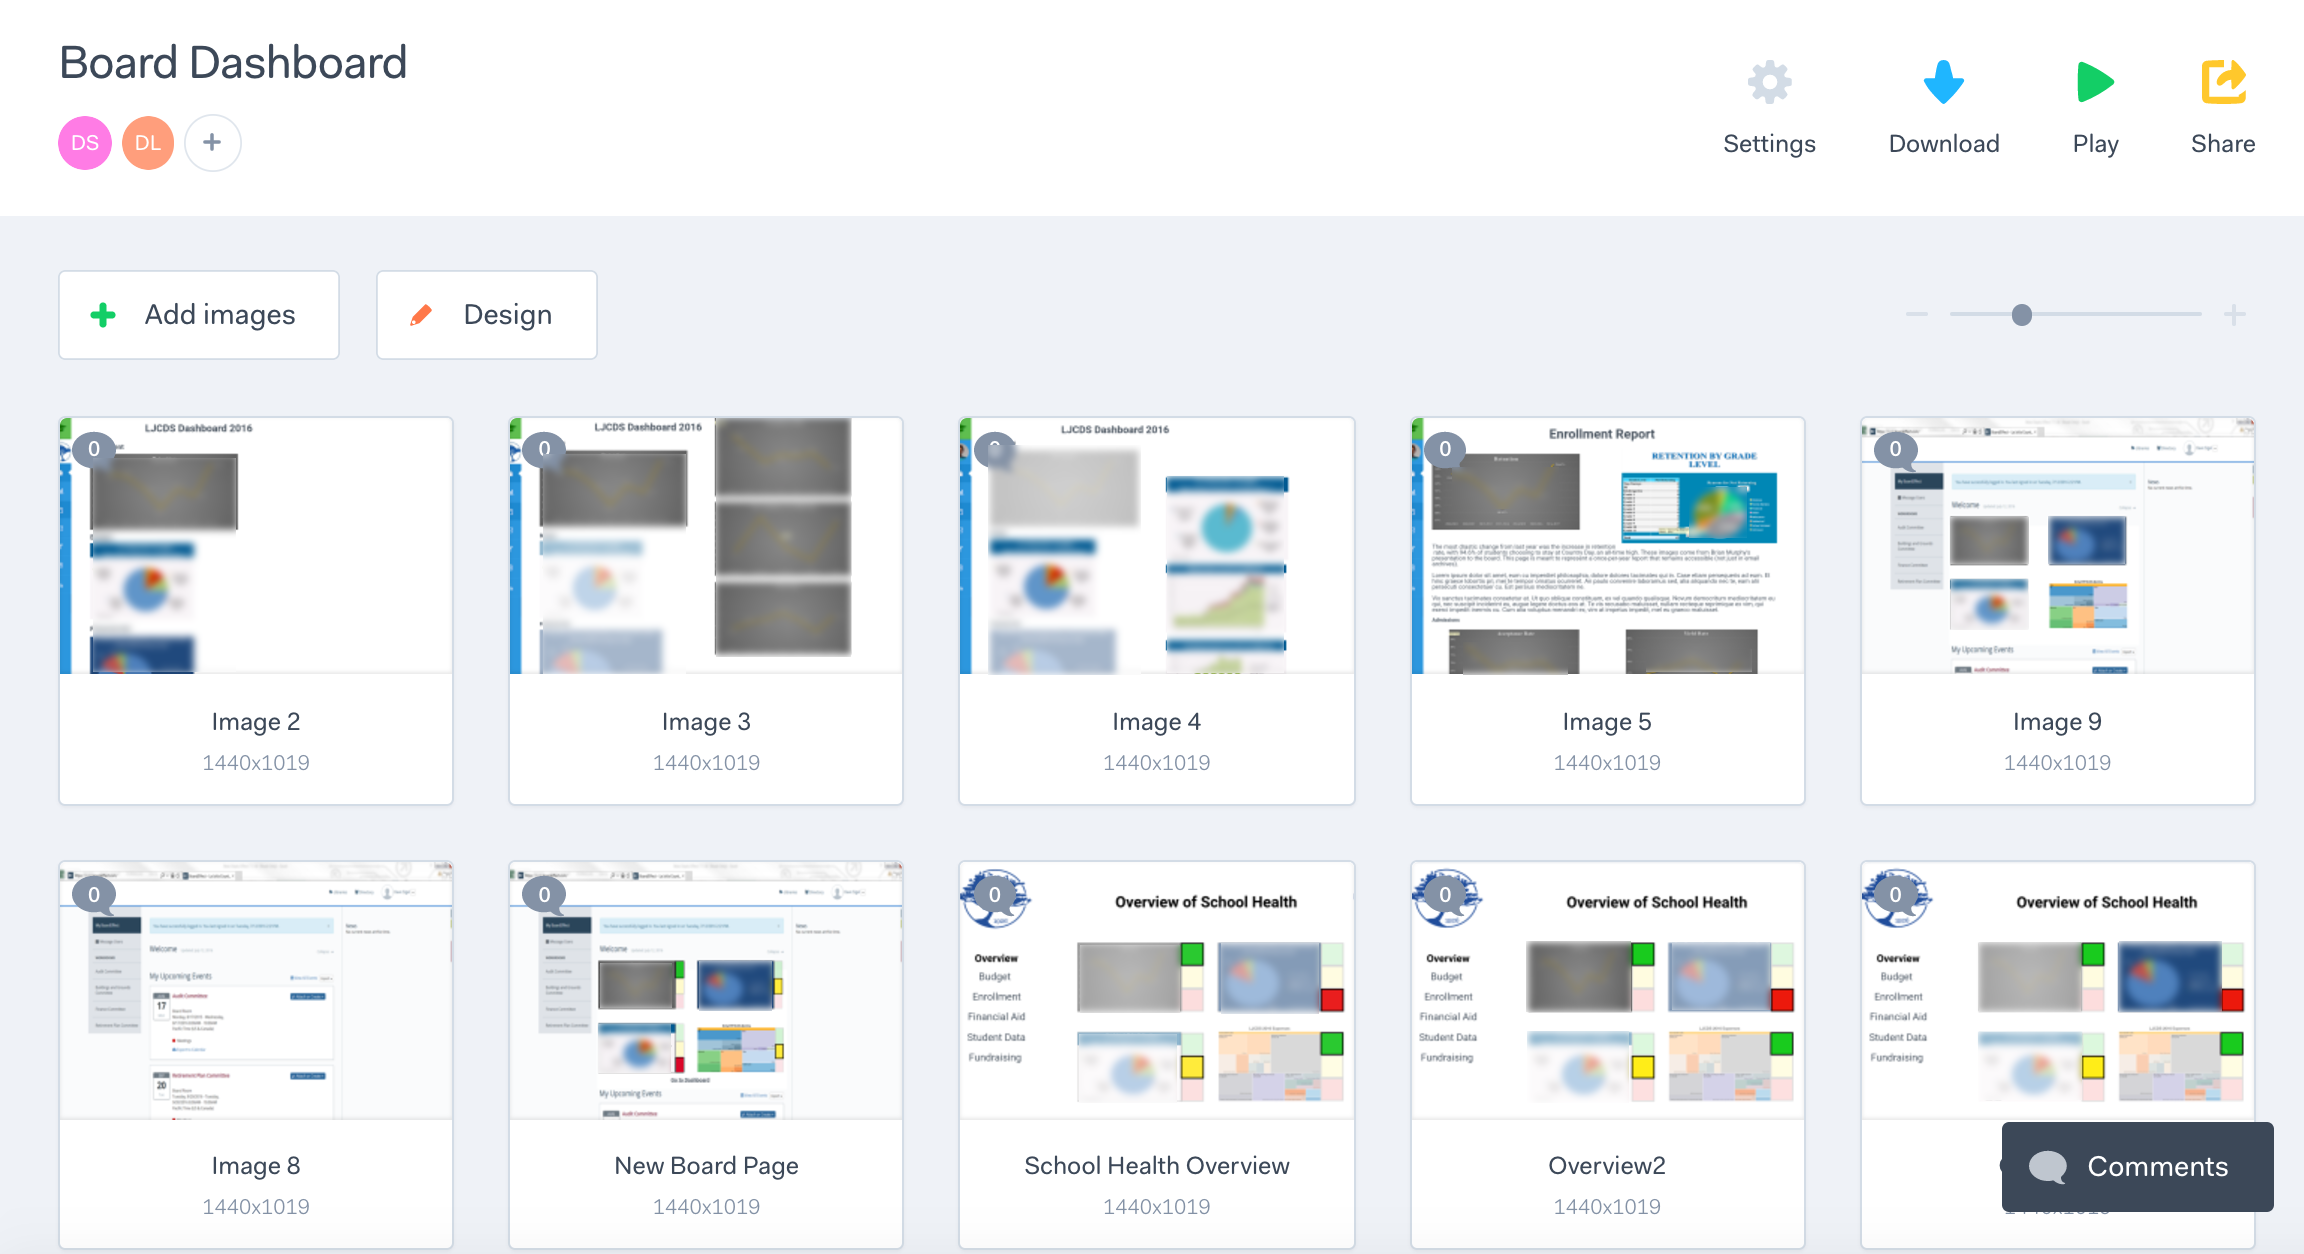
Board Dashboard
1. Re-analysis of existing data.
More complex visualizations of existing data to show new relationships.
2. Interactive visualizations of table data for exploration.
Our budget data in visual form.
3. New metrics from web scraping tied to our data.
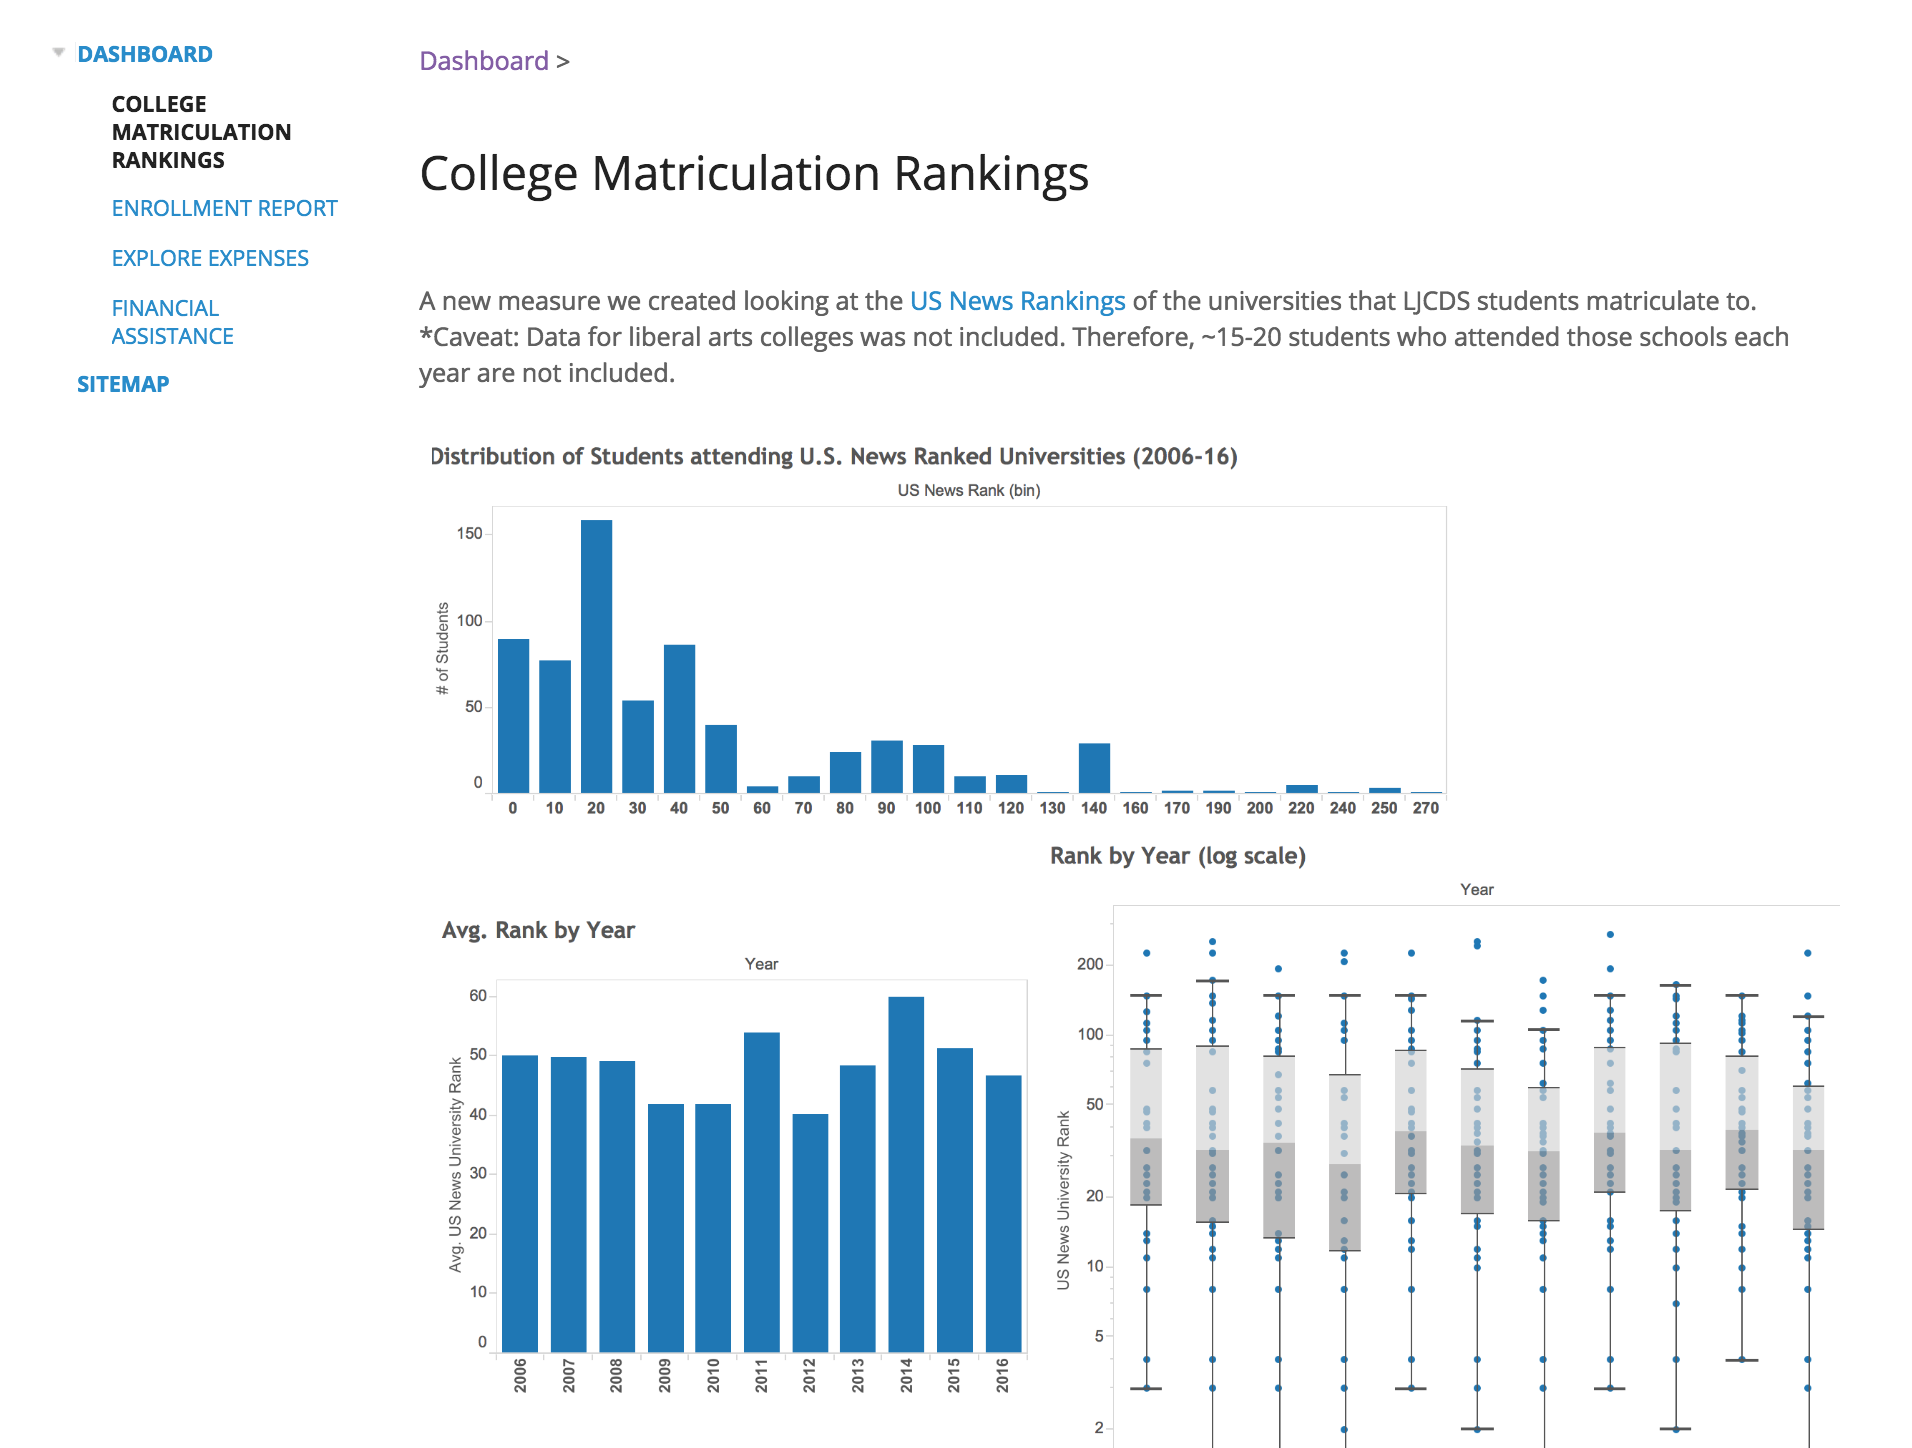
In this case, analysis of the "rankings" of the schools our graduates matriculated to.


